The HBase BlockCache is an important structure for enabling low
latency reads. As of HBase 0.96.0, there are no less than three different
BlockCache implementations to choose from. But how to know when to use one
over the other? There’s a little bit of guidance floating around out there, but
nothing concrete. It’s high time the HBase community changed that! I did some
benchmarking of these implementations, and these results I’d like to share with
you here.
Note that this is my second post on the BlockCache. In my
previous post, I provide an overview of the BlockCache in general as
well as brief details about each of the implementations. I’ll assume you’ve
read that one already.
The goal of this exercise is to directly compare the performance of different
BlockCache implementations. The metric of concern is that of client-perceived
response latency. Specifically, the concern is for the response latency at the
99th percentile of queries – that is, the worst case experience that the vast
majority of users will ever experience. With this in mind, two different
variables are adjusted for each test: RAM allotted and database size.
The first variable is the amount of RAM made available to the RegionServer
process and is expressed in gigabytes. The BlockCache is sized as a portion
of the total RAM allotted to the RegionServer process. For these tests, this is
fixed at 60% of total RAM. The second variable is the size of the database over
which the BlockCache is operating. This variable is also expressed in
gigabytes, but in order to directly compare results generated as the first
variable changes, this is also expressed as the ratio of database size to RAM
allotted. Thus, this ratio is a rough description for the amount “cache churn”
the RegionServer will experience, regardless of the magnitude of the values.
With a smaller ratio, the BlockCache spends less time juggling blocks and
more time servicing reads.
Test Configurations
The tests were run across two single machine deployments. Both machines are identical, with 64G total RAM and 2x Xeon E5-2630@2.30GHz, for a total of 24 logical cores each. The machines both had 6x1T disks sharing HDFS burden, spinning at 7200 RPM. Hadoop and HBase were deployed using Apache Ambari from HDP-2.0. Each of these clusters-of-one were configured to be fully “distributed,” meaning that all Hadoop components were deployed as separate processes. The test client was also run on the machine under test, so as to omit any networking overhead from the results. The RegionServer JVM, Hotspot 64-bit Server v1.6.0_31, was configured to use the CMS collector.
Configurations are built assuming a random-read workload, so
MemStore capacity is sacrificed in favor of additional space for
the BlockCache. The default LruBlockCache is considered
the baseline, so that cache is configured first and its memory allocations are
used as guidelines for the other configurations. The goal is for each
configuration to allow roughly the same amount of memory for the BlockCache,
the MemStores, and other activities of the HBase process itself.
It’s worth noting that the LruBlockCache configuration includes checks to
ensure that JVM heap within the process is not oversubscribed. These checks
enforce a limitation that only 80% of the heap may be assigned between the
MemStore and BlockCache, leaving the remaining 20% for other HBase process
needs. As the amount of RAM consumed by these configurations increases, this
20% is likely overkill. A production configuration using so much heap would
likely want to override this over-subscription limitation. Unfortunately, this
limit is not currently exposed as a configuration parameter. For large memory
configurations that make use of off-heap memory management techniques, this
limitation is likely not encountered.
Four different memory allotments were exercised: 8G (considered “conservative”
heapsize), 20G (considered “safe” heapsize), 50G (complete memory subscription
on this machine), and 60G (memory over-subscription for this machine). This is
the total amount of memory made available to the RegionServer process. Within
that process, memory is divided between the different subsystems, primarily the
BlockCache and MemStore. Because some of the BlockCache implementations
operate on RAM outside of the JVM garbage collector’s control, the size of the
JVM heap is also explicitly mentioned. The total memory divisions for each
configuration are as follows. Values are taken from the logs;
CacheConfig initialization in the case of BlockCache
implementations and MemStoreFlusher for the max heap and
global MemStore limit.
| Configuration | Total Memory | Max Heap | BlockCache Breakdown | Global MemStore Limit |
|---|---|---|---|---|
| LruBlockCache | 8G | 7.8G | 4.7G lru | 1.6G |
| SlabCache | 8G | 1.5G | 4.74G slabs + 19.8m lru | 1.9G |
| BucketCache, heap | 8G | 7.8G | 4.63G buckets + 47.9M lru | 1.6G |
| BucketCache, offheap | 8G | 1.9G | 4.64G buckets + 48M lru | 1.5G |
| BucketCache, tmpfs | 8G | 1.9G | 4.64G buckets + 48M lru | 1.5G |
| LruBlockCache | 20G | 19.4G | 11.7G lru | 3.9G |
| SlabCache | 20G | 4.8G | 11.8G slabs + 48.9M lru | 3.8G |
| BucketCache, heap | 20G | 19.4G | 11.54G buckets + 119.5M lru | 3.9G |
| BucketCache, offheap | 20G | 4.9G | 11.60G buckets + 120.0M lru | 3.8G |
| BucketCache, tmpfs | 20G | 4.8G | 11.60G buckets + 120.0M lru | 3.8G |
| LruBlockCache | 50G | 48.8G | 29.3G lru | 9.8G |
| SlabCache | 50G | 12.2G | 29.35G slabs + 124.8M lru | 9.6G |
| BucketCache, heap | 50G | 48.8G | 30.0G buckets + 300M lru | 9.8G |
| BucketCache, offheap | 50G | 12.2G | 29.0G buckets + 300.0M lru | 9.6G |
| BucketCache, tmpfs | 50G | 12.2G | 29.0G buckets + 300.0M lru | 9.6G |
| LruBlockCache | 60G | 58.6G | 35.1G lru | 11.7G |
| SlabCache | 60G | 14.6G | 35.2G slabs + 149.8M lru | 11.6G |
| BucketCache, heap | 60G | 58.6G | 34.79G buckets + 359.9M lru | 11.7G |
| BucketCache, offheap | 60G | 14.6G | 34.80G buckets + 360M lru | 11.6G |
| BucketCache, tmpfs | 60G | 14.6G | 34.80G buckets + 360.0M lru | 11.6G |
These configurations are included in the test harness repository.
Test Execution
HBase ships with a tool called PerformanceEvaluation, which is
designed for generating a specific workload against an HBase cluster. These
tests were conducted using the randomRead workload, executed in
multi-threaded mode (as opposed to mapreduce mode). As of
HBASE-10007, this tool can produce latency information for
individual read requests. YCSB was considered as an alternative load
generator, but PerformanceEvaluation was preferred because it is provided
out-of-the-box by HBase. Thus, hopefully these results are easily reproduced by
other HBase users.
The schema of the test dataset is as follows. It is comprised of a single table with a single column family, called “info”. Each row contains a single column, called “data”. The rowkey is 26 bytes long; the column value is 1000 bytes. Thus, a single row is a total of 1032 bytes, or just over 1K, of user data. Cell tags were not enabled for these tests.
The test was run three times for each configuration: database size to RAM
allotted ratios of 0.5:1, 1.5:1, and 4.5:1. Because the BlockCache consumes
roughly 60% of available RegionServer RAM, these ratios translated roughly into
database size to BlockCache size ratios of 1:1, 3:1, 9:1. That is, roughly,
not exactly, and in the BlockCache’s favor. Thus, with the first
configuration, the BlockCache shouldn’t need to ever evict a block while in
the last configuration, the BlockCache will be evicting stale blocks
frequently. Again, the goal here is to evaluate the performance of a
BlockCache as it experiences varying working conditions.
For all tests, the number of clients was fixed at 5, far below the number of available RPC handlers. This is consistent with the desire to benchmark individual read latency with minimal overhead from context switching between tasks. A future test can examine the overall latency (and, hopefully, throughput) impact of varying numbers of concurrent clients. My intention with HBASE-9953 is to simplify managing this kind of test.
Before a test is run, the database is created and populated. This is done using
the sequentialWrite command, also provided by PerformanceEvaluation. Once
created, the RegionServer was restarted using the desired configuration and the
BlockCache warmed. Warming the cache was performed in one of two ways,
depending on the ratio of database size to RAM allotted. For the 0.5:1, the
entire table was scanned with a scanner configured with cacheBlocks=true. For
this purpose, a modified version of the HBase shell’s count command was used.
For other ratios, the randomRead command was used with a sampling rate of 0.1.
With the cache initially warmed, the test was run. Again, randomRead was used
to execute the test. This time the sampling rate was set to 0.01 and the
latency flag was enabled so that response times would be collected. This test
was run 3 times, with the last run being collected for the final result. This
was repeated for each permutation of configuration and database:RAM ratio.
HBase served no other workload while under test – there were no concurrent scan or write operations being served. This is likely not the case with real-world application deployments. The previous table was dropped before creating the next, so that the only user table on the system was the table under test.
The test harness used to run these tests is crude, but it’s available for inspection. It also includes patch files for all configurations, so direct reproduction is possible.
Initial Results
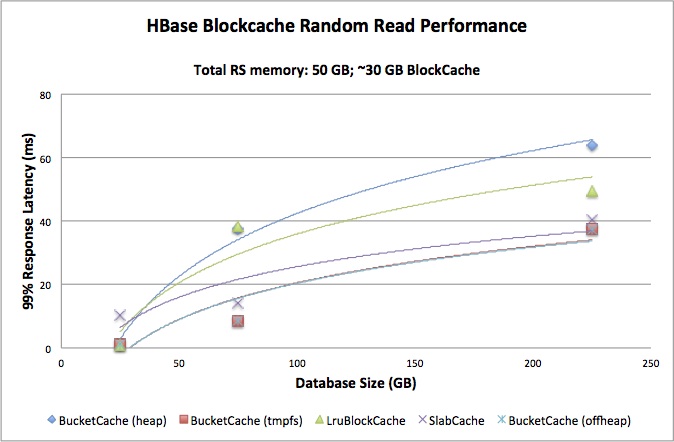
The first view on the data is comparing the behavior of implementations at a given memory footprint. This view is informative of how an implementation performs as the ratio of memory footprint to database size increases. The amount of memory under management remains fixed. With the smallest memory footprint and smallest database size, the 99% response latency is pretty consistent across all implementations. As the database size grows, the heap-based implementations begin to separate from the pack, suffering consistently higher latency. This turns out to be a consistent trend regardless of the amount of memory under management.
Also notice that the LruBlockCache is holding its own alongside the off-heap
implementations with the 20G RAM hosting both the 30G and 90G data sets. It
falls away in the 50G RAM test though, which indicates to me that the effective
maximum size for this implementation is somewhere between these two values.
This is consistent with the “community wisdom” referenced in the
previous post.
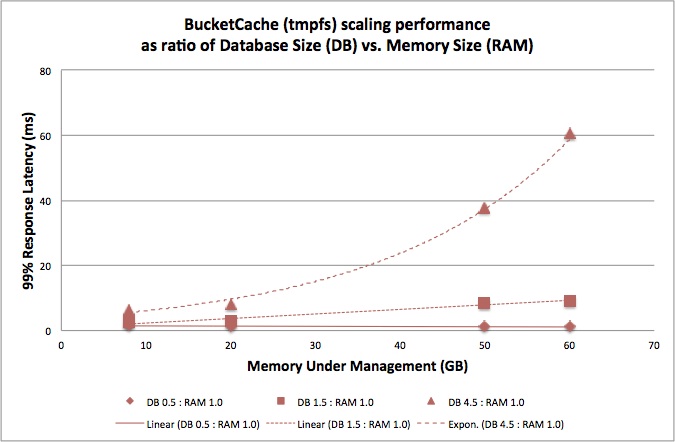
The second view is a pivot on the same data that looks at how a single implementation performs as the overall amount of data scales up. In this view, the ratio of memory footprint to database size is held fixed while the absolute values are increased. This is interesting as it suggests how an implementation might perform as it “scales up” to match increasing memory sizes provided by newer hardware.
From this view it’s much easier to see that both the LruBlockCache and
BucketCache implementations suffer no performance degradation with increasing
memory sizes – so long as the dataset fits in RAM. This result for the
LruBlockCache surprised me a little. It indicates to me that under the
conditions of this test, the on-heap cache is able to reach a kind of
steady-state with the Garbage Collector.
The other surprise illustrated by this view is that the SlabCache imposes
some overhead on managing increasingly larger amounts of memory. This overhead
is present even when the dataset fits into RAM. In this, it is inferior to the
BucketCache.
From this view’s perspective, I believe the BucketCache running in tmpfs
mode is the most efficient implementation for larger memory footprints, with
offheap mode coming in a close second. Operationally, the offheap mode is
simpler to configure as it requires only changes to HBase configuration files.
It also suggests the cache is of decreasing benefit with larger datasets
(though this should be intuitively obvious).
Based on this data, I would recommend considering use of an off-heap
BucketCache cache solution when your database size is far larger than the
amount of available cache, especially when the absolute size of available
memory is larger than 20G. This data can be used to inform the purchasing
decisions regarding amount of memory required to host a dataset of a given
size. Finally, I would consider deprecating the SlabCache implementation in
favor of the BucketCache.
Here’s the raw results. It includes additional latency measurements at the 95% and 99.9%.
Followup test
With the individual implementation baselines established, it’s time to examine
how a “real world” configuration holds up. The BucketCache and SlabCache
are designed to be run as a multi-level configuration, after all. For this, I
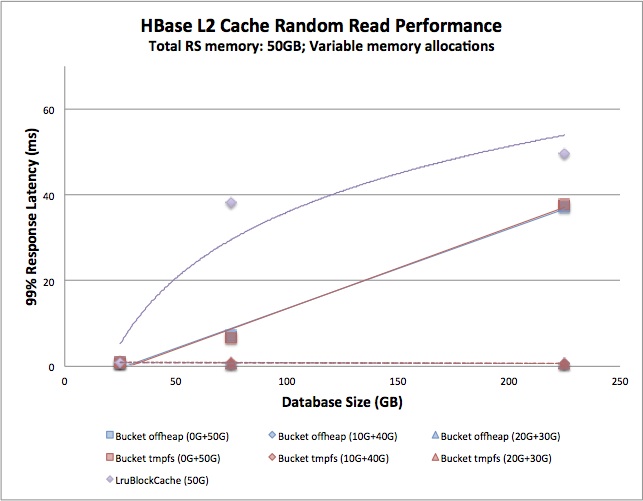
chose to examine only the 50G memory footprint. The total 50G was divided
between onheap and offheap memory. Two additional configurations were created
for each implementation: 10G onheap + 40G offheap and 20G onheap + 30G offheap.
These are compared to running with the full 50G heap and LruBlockCache.
This result is the most impressive of all. When properly configured in L1+L2
deployment, the BucketCache is able to maintain sub-millisecond response
latency even with the largest database tested. This configuration significantly
outperforms both the single-level LruBlockCache and the (effectively)
single-level BucketCache. There is no apparent difference between 10G heap
and 20G heap configurations, which leads me to believe, for this test, the
non-data blocks fit comfortably in the LruBlockCache with even the 10G heap
configuration.
Again, the raw results with additional latency measurements.
Conclusions
When a dataset fits into memory, the lowest latency results are experienced
using the LruBlockCache. This result is consistent regardless of how large
the heap is, which is perhaps surprising when compared to “common wisdom.”
However, when using a larger heap size, even a slight amount of BlockCache
churn will cause the LruBlockCache latency to spike. Presumably this is due
to the increased GC activity required to manage a large heap. This indicates to
me that this test establishes a kind of false GC equilibrium enjoyed by this
implementation. Further testing would intermix other activities into the
workload and observe the impact.
When a dataset is just a couple times larger than available BlockCache and
the region server has a large amount of RAM to dedicate to caching, it’s time
to start exploring other options. The BucketCache using the file
configuration running against a tmpfs mount holds up well to an increasing
amount of RAM, as does the offheap configuration. Despite having slightly
higher latency than the BucketCache implementations, the SlabCache holds
its own. Worryingly, though, as the amount of memory under management
increases, its trend lines show a gradual rise in latency.
Be careful not to oversubscribe the RAM in systems running any of these
configurations, as this causes latency to spike dramatically. This is most
clear in the heap-based BlockCache implementations. Oversubscribing the
memory on a system serving far more data than it has available cache results in
the worst possible performance.
I hope this experiment proves useful to the wider community. Hopefully these results can be reproduced without difficulty and that other can pick up where I’ve left off. Though these results are promising, a more thorough study is warranted. Perhaps someone out there with even larger memory machines can extend the X-axis of these graphs into the multiple-hundreds of gigabytes.


